
Figure 4.
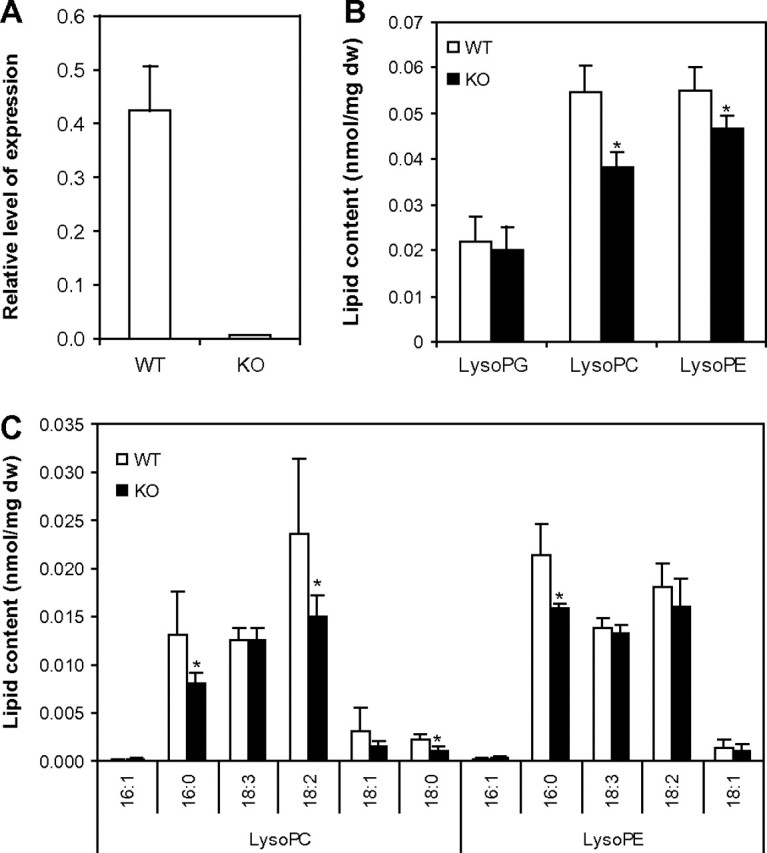
Lysophospholipid Level in pPLAIIα-KO and WT Leaves.
(A) Relative level of pPLAIIα gene expression in wild-type and mutant plants was checked with real-time quantitative PCR.
(B) Profiles of total LPC, LPE, and LPG in WT and mutants.
(C) Profiles of LPC and LPE species in WT and mutant plants. Values are means ± SD (n = 5). Statistically significant differences between the wild-type and mutant line are marked with asterisks (p < 0.05, according to Student’s t-test).