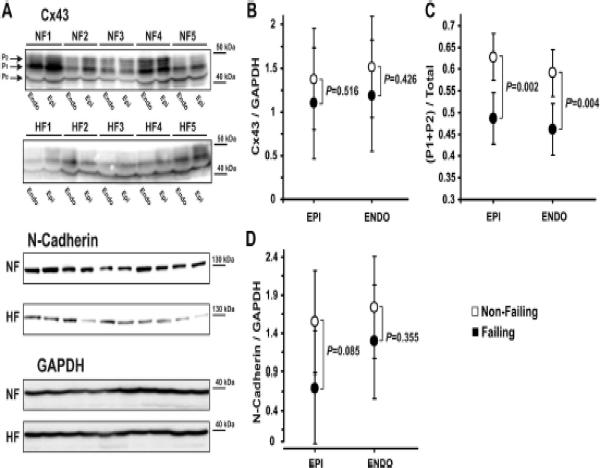
Figure 5.
Western blot analysis. A: Subepicardial (Epi) and subendocardial (Endo) expression of Cx43 (two top panels), N-Cadherin (middle panel), and GPDH (bottom panel). Different phosphorylated bands for Cx43 protein were observed: the higher-molecular-weight and higher phosphorylated isoforms (P1 and P2) and the lower-molecular-weight and dephosphorylated isoform (P0). B: Average data for Cx43 expression are presented on panel A. C: Redistribution of phosphorylated isoforms of Cx43 during HF in subepicardium and subendocardium. D: Average data for N-Cadherin expression are presented on panel A.

