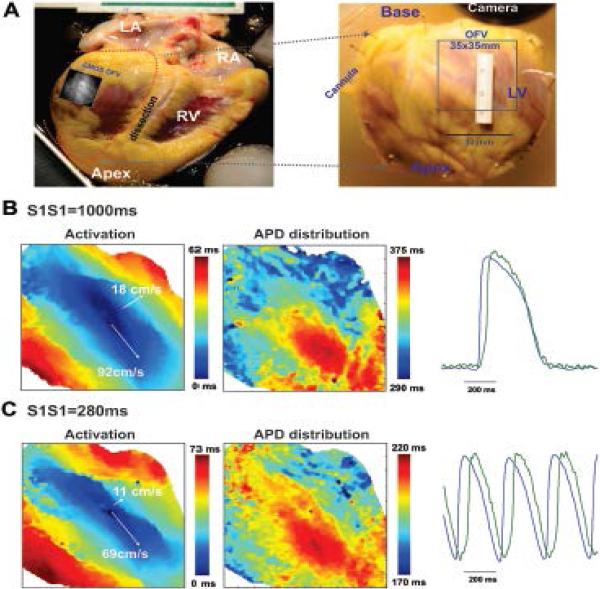
Figure 7.
Optical mapping of the epicardial surface of a non-failing human heart. A: Epicardial optical mapping of the isolated, left ventricle free wall preparation (marked by dotted line on the left panel) was conducted. Optical field of view (OFV: 35 mm by 35 mm) is denoted by square. Activation and APD distribution patterns are shown for slow (B, S1S1=1,000 ms) and fast (C, S1S1=280 ms) pacing. The gradual shortening of pacing interval depressed conduction velocity along the transverse direction and resulted in increased conduction anisotropy without any conduction abnormalities. LA and RA – left and right atria; LV and RV – left and right ventricle.

