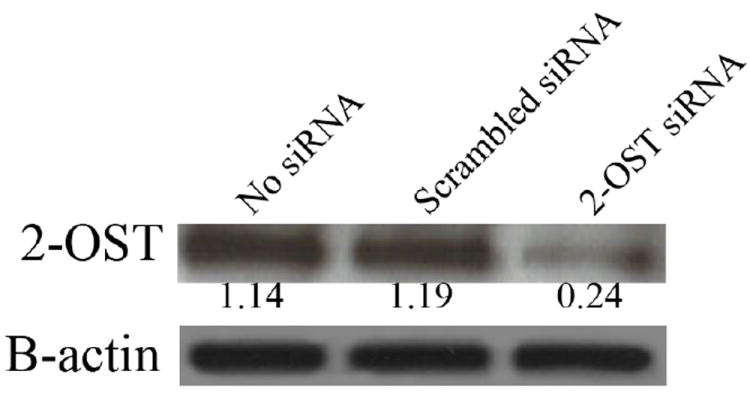
Fig. 4.

Western Blot analysis of 2-OST protein expression after siRNA down regulation. 2-OST protein expression was measured in a sample of CHO-K1 cells treated with 2-OST siRNA, scrambled siRNA, or mock treated cells (no siRNA). Protein expression was measured 48 h after siRNA transfection. β-actin protein expression was measured as a loading control. Protein bands were quantified using NIH ImageJ v1.41.
