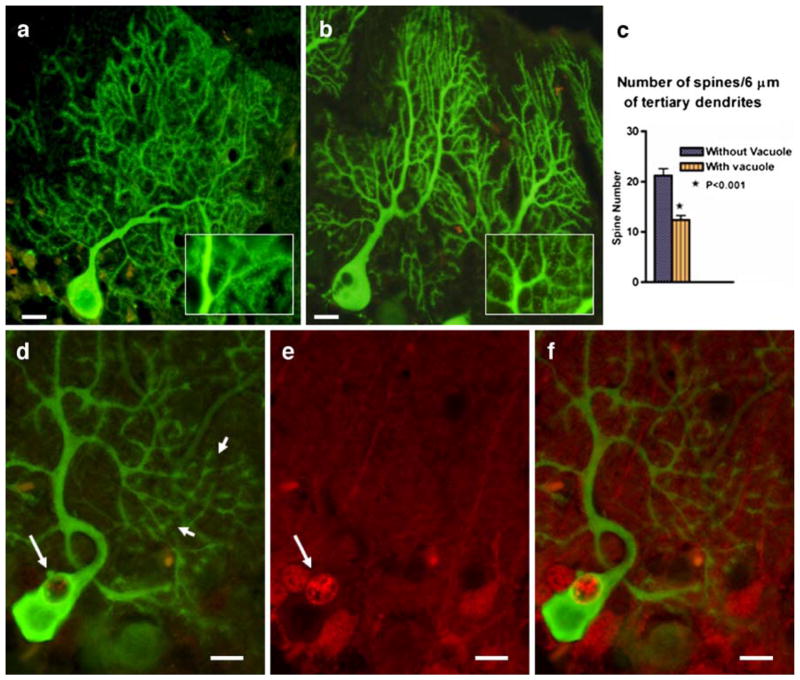
Fig. 5.
GFP expressing wild-type and SCA1 PCs from 4-week-old mice (a, b). Sections were immunostained for GFP (green). The inset in b shows a marked decrease in spine density in SCA1 as compared to wild-type in a. c Six micrometers of tertiary dendrites was sampled (n=10) from different regions of the dendritic tree of PCs with and without vacuoles using Image-Pro Plus image analysis system (Media Cybernetics). The number of spines present in those sampled lengths were calculated and subjected to statistical analysis. Significant differences in the spine numbers were calculated using GraphPad Prism, unpaired Student’s t test for independent samples, version 4.0 (GraphPad Software). A value of P<0.05 was accepted as statistically significant. d–f Double immunostaining showing GFP (green, d) and S100B (red, e) localization to PCs in a 4-week-old SCA1 mouse cerebellum. The large arrows indicate the presence of S100B containing cytoplasmic vacuole in PC, and the small arrows show that this PC with S100B vacuole exhibit cluster-like dendritic spine structures. f Merged image

