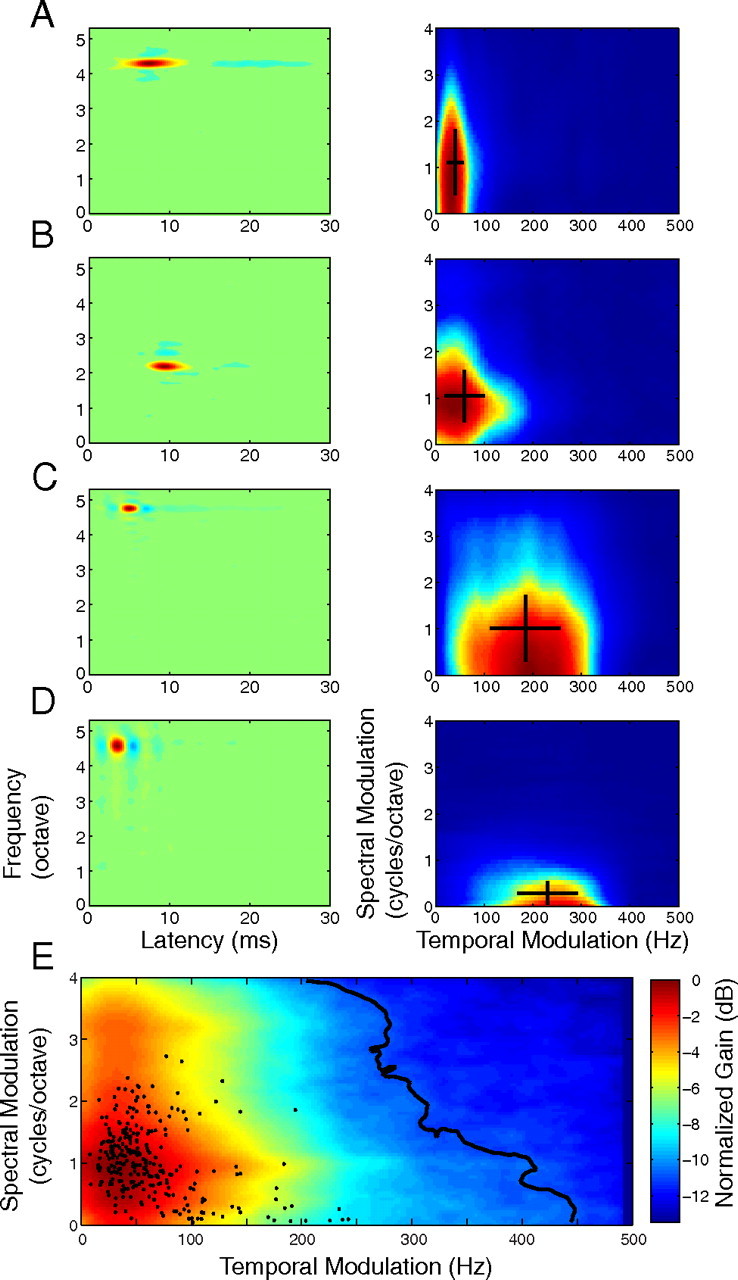
Figure 3.

Tradeoff in neural spectrotemporal tuning in the inferior colliculus. A–D, Example STRF and the corresponding MTFs from four CNIC neurons. The example STRFs (A–D, left) are ordered from slow to fast integration times (A, 6.6 ms; B, 3.92 ms; C, 2.12 ms; D, 2.13 ms). The STRF bandwidths for these examples represent the average width of the STRF (A, 0.20 octave; B, 0.25 octave; C, 0.18 octave; D, 0.43 octave). As can be seen, neurons can be sharply or broadly tuned in frequency or can alternately exhibit short or long integration times. The STRF structure is directly related to the modulation tuning characteristics of each neuron (A–D, MTF shown on right). STRFs with slow integration times (A) prefer slower temporal modulation while faster STRFs prefer higher temporal modulations (D). Similarly, narrowband STRFs with strong sideband inhibition tend to prefer higher spectral modulations (A) while broadband STRFs prefer slower spectral modulations (D). Temporal and spectral modulation bandwidths account for the sharpness of modulation tuning and are depicted by the horizontal and vertical black bars. The intersection of these bars represents the characteristic temporal and spectral modulation of each neuron. E, The ensemble average MTF for the CNIC shows the gain of the ensemble as a function cTMF and cSMF (color plot). Dots represent the cTMF and cSMF of each neuron and black contours represent the region of the MTF space that accounts for 90% of the response power. Note that at the extremes, neurons can respond to fast temporal modulations (high cTMF) or fine spectral modulations (high cSMF), but not both.
