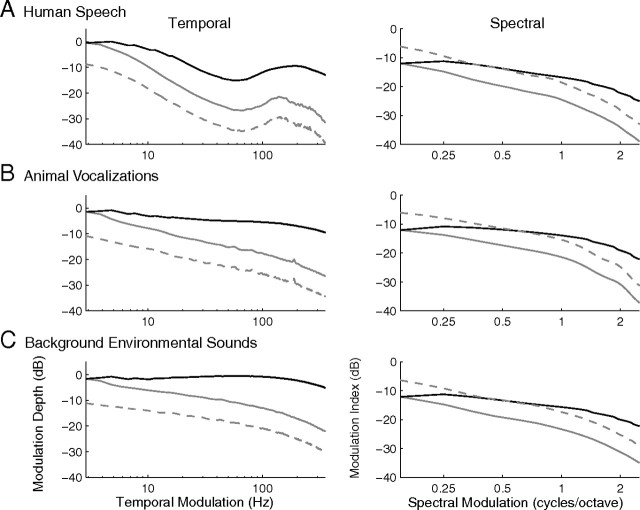
Figure 7.
CNIC filtering characteristics equalize the modulation power of natural sounds. A–C show the temporal (left) and spectral (right) MPS (dashed gray lines) for the three natural sound ensembles (human speech, animal vocalizations and background environmental sounds; same as in Fig. 2). To determine the degree of power equalization conferred by the CNIC ensemble, the MPS of natural sounds were passed through a modulation filterbank in which modulation bandwidths scale as for the CNIC neural ensemble (see Materials and Methods). Black lines in A–C represent the CNIC model filterbank output MPS. For reference the MPS were also filtered with an equal resolution filterbank analogous to Figure 1A (gray lines). There is marked flattening in the modulation power at the output of the CNIC model but not for the equal resolution filters.

