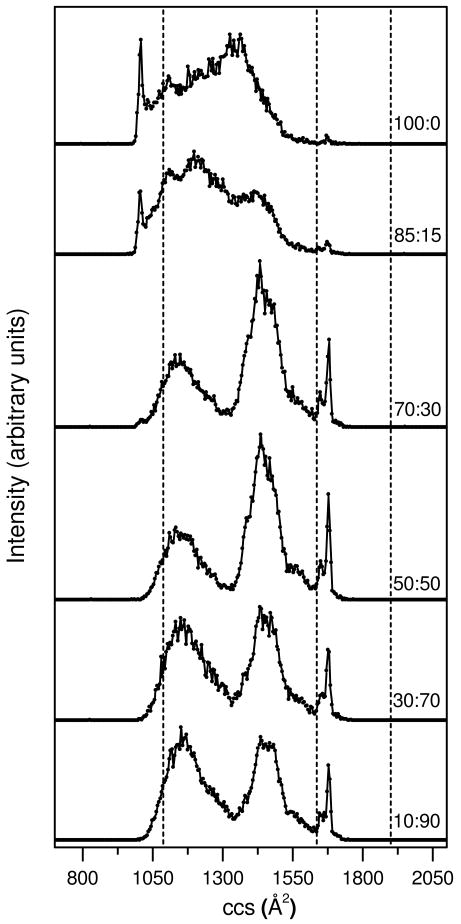
Figure 2.
Collision cross section (ccs) distributions for [M+8H]8+ ubiquitin ions from six different water:methanol solutions. The plots have been obtained from nested tD(m/z) data sets where all m/z bins over a narrow range (corresponding to [M+8H]8+ ubiquitin ions) have been integrated for each tD bin. Solution compositions (water:methanol) are provided as labels for each of the distributions. The data sets have been normalized by using the integrated peak intensity. Dashed lines are drawn to indicate the calculated ccs for the N, A, and U state model structures shown in Figure 1.

