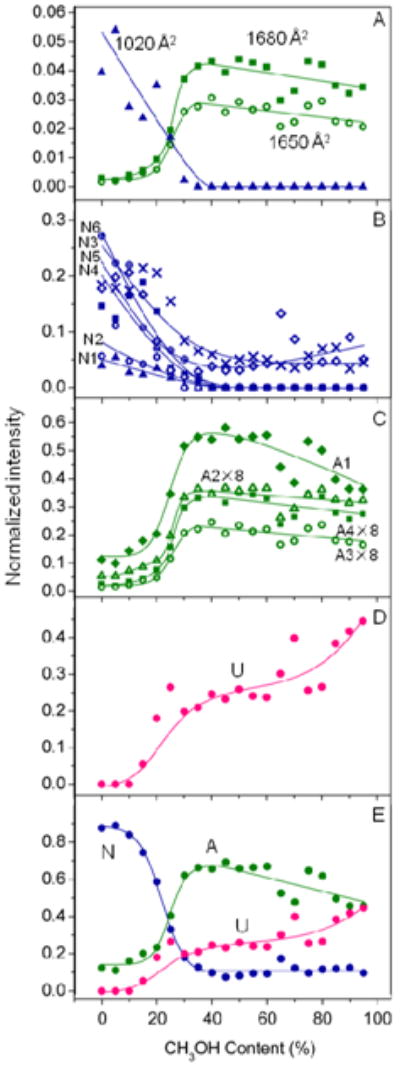
Figure 5.

Plots of peak intensity as a function of solvent methanol percentage for different gas-phase conformation types. (A) shows intensities for the three sharp conformer types having Ω = 1020 ± 6 (
 ), Ω = 1650 ± 11 (
 ) and Ω = 1680 ± 6 Å2 (
 ). The most compact feature has been assigned to the N state and the more elongated features have been assigned to the A state. (B), (C) and (D) show intensities for the gas-phase conformers that are assigned to the solution states of ubiquitin, N, A, and U, respectively. The labels N1-N6, A1-A4, and U correspond to the assignments in Table 1. N1:1020 ± 6 Å2 (
 ), N2: 1040 ± 25 Å2 (
 ), N3: 1120 ± 41 Å2 (
 ), N4: 1210 ± 34 Å2 (
 ), N5: 1290 ± 42 Å2 (
 ),N6: 1360 ± 47 Å2 (
 ); A1: 1450 ± 49 Å2 (
 ), A2: 1570 ± 28 Å2 (
 ), A3: 1650 ± 11 Å2 (
 ), A4: 1680 ± 6 Å2 (
 ); U: 1160 ± 60 Å2 (
 ). Intensity multiplication factors are listed for specific conformer types. (E) shows the sum of the intensities for different gas-phase conformation types that are assigned to the N, A and U states of ubiquitin. Conformer types that are assigned to the N, A and U states of ubiquitin are plotted in blue, green and pink, respectively.
