Figure 1.
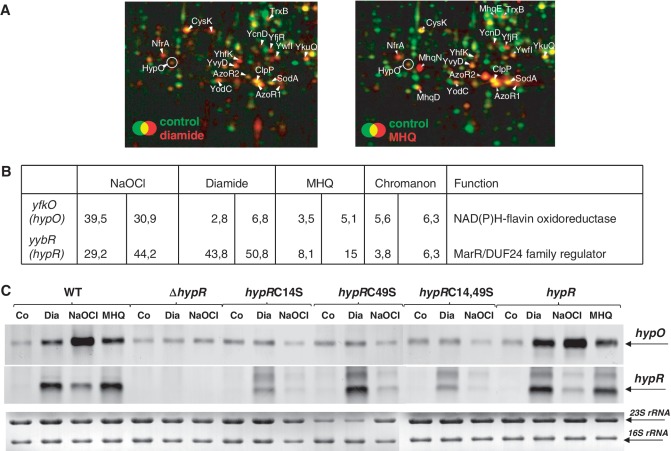
HypO induction in the proteome (A), transcriptional induction of hypO and hypR in the transcriptome (B) and northern blot analysis of hypO and hypR transcription (C) under thiol-specific stress conditions. (A) Cytoplasmic proteins were labelled with 35S-methionine before (control) and after stress exposure and separated by 2D–PAGE as described (36). Close-ups of the overlay proteome images are shown for the wild-type before (green images) and 10 min after exposure to 1 mM diamide (left, red image) or 0.5 mM MHQ (right, red image). Proteins with increased protein synthesis ratios after MHQ and diamide stress including HypO are labelled that were identified from Coomassie-stained 2D gels as described (36). (B) The values represent fold-changes of hypR and hypO induction ratios in two biological replicates of transcriptome experiments of cells treated with 1 mM diamide, 0.5 mM MHQ, 50 µM NaOCl and 100 µM chromanon according to previously published transcriptome data (17,26,44). (C) Northern blot analysis was performed using RNA isolated from B. subtilis wild-type, the ΔhypR mutant and the ΔhypR mutant complemented with hypR, hypRC14S, hypRC49S and hypRC14,49S before (co) and 10 min after treatment with 0.5 mM MHQ, 1 mM diamide and 50 µM NaOCl. The arrows point toward the hypO and hypR specific transcripts. The methylen-blue stained northern blot is shown below as RNA loading control and the 16S and 23S rRNAs are labelled.

