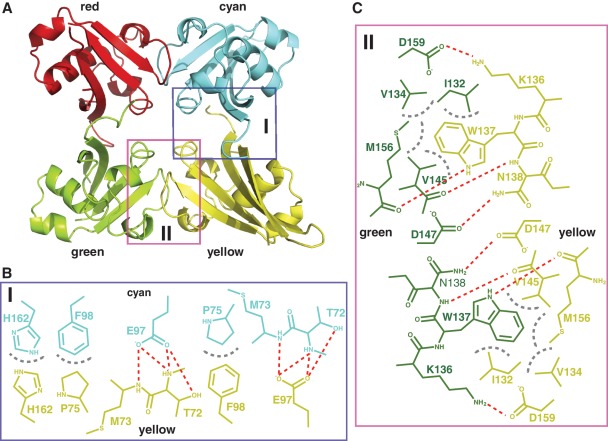
Figure 2.
Interface of the SATB1 ULD homotetramer. (A) Ribbon diagram of a representative SATB1 ULD homotetramer. The four individual ULDs are colored red, cyan, green and yellow. Schematic diagrams showing the detailed interactions within the cyan–yellow dimer (B) and the green–yellow dimer (C). The color of the residues within each dimer interface is same as that of the individual ULDs in (A). Hydrogen bonds and hydrophobic interactions are shown as red and gray dotted lines, respectively.

