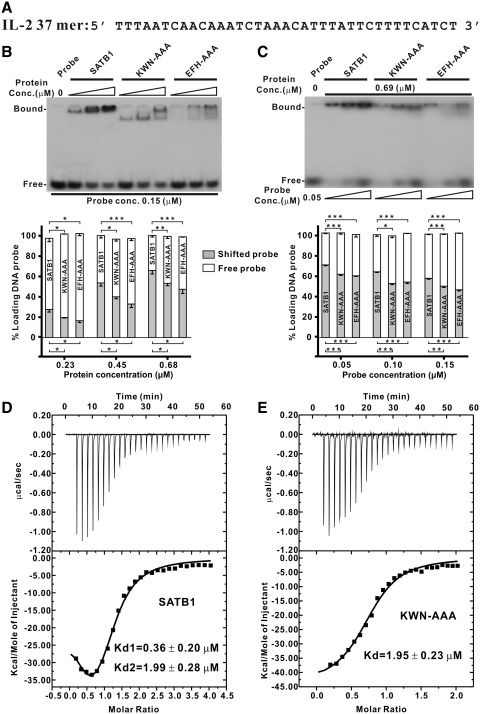
Figure 4.
DNA binding affinity of wild-type and SATB1 mutants measured by EMSA and ITC. (A) Nucleotide sequence of the interleukin-2 (IL-2) promoter region spanning base pairs −447 to −441 from the translation site. (B and C) EMSA assay. The binding of SATB1 and its mutants to a target DNA probe was tested by EMSA using the radiolabeled synthetic duplex oligonucleotides shown in (A). The EMSA was carried out with various protein (B, top) or probe concentrations (C, top). Bar graph of DNA binding affinity from the dose-dependent EMSA of protein (B, bottom) or DNA probe (C, bottom). The radioactive intensities of protein-bound DNA bands and free DNA probe reduction due to protein binding were calculated with Adobe Photoshop CS4 and normalized to that of the free DNA probe. The error bars indicate the standard error mean (n = 3 separate experiments). *P < 0.05; **P-value < 0.01; ***P < 0.005. The dissociation constants (Kd's) of SATB1 (D) and the KWN–AAA mutant (E) with IL-2 37-bp DNA shown in (A) were measured by ITC. The Kd’s were calculated by a two-site binding model for wild-type SATB1 to give Kd1 of ∼0.36 µM and Kd2 of ∼1.99 µM. For the KWN–AAA mutant, the data were fit to a one-site binding model to give a Kd of ∼1.95 µM.

