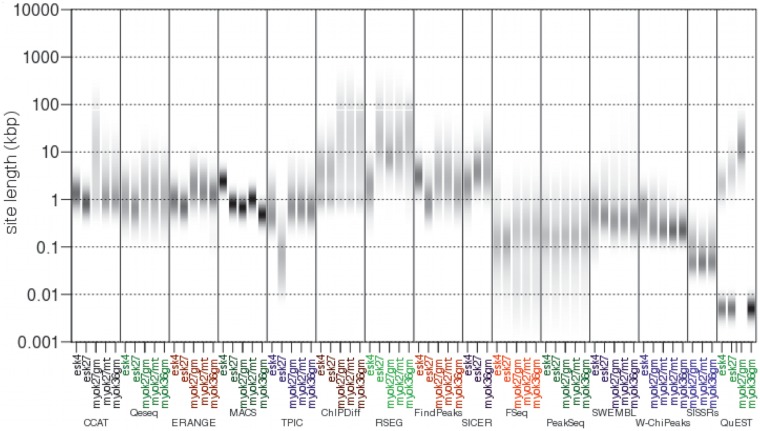
Figure 4.
Distribution of lengths of binding events detected by 15 ChIP-Seq algorithms in histone modification datasets. For each algorithm and for each dataset the distribution of site lengths is displayed as a density heatmap. The empirical probability of an event length is shown in greyscale, with darker grey indicating higher probability. Algorithms such as MACS and SISSRs exhibit a short range of event lengths. Other algorithms, such as ChIPDiff and QuEST have a broader spectrum of site lengths. Default settings were used in all algorithms.

