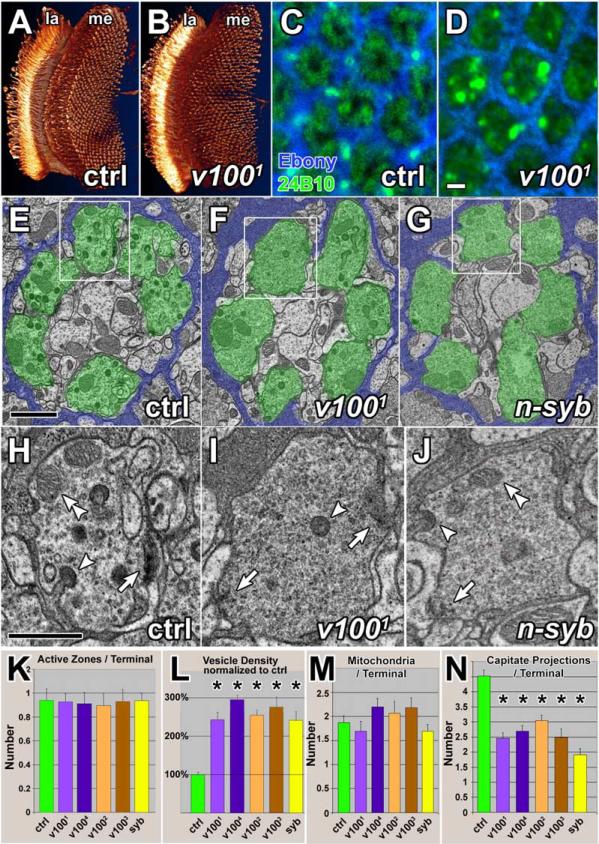
Figure 3. Ultrastructural Analysis of Mutant Photoreceptor Terminals in the Lamina.
(A) 3D visualization of control photoreceptor neurons stained with mAb 24B10. la: lamina; me: medulla.
(B) Visualization of v1001 mutant photoreceptor neurons as in (A) projecting into a heterozygous control brain.
(C) Cross-section through a control lamina, showing the hexagonal pattern of cartridges, synaptic units that are demarcated by epithelial glia (blue) and contain the presynaptic photoreceptor terminals (green).
(D) Lamina cross-section containing v1001 mutant photoreceptor terminals. The overall cartridge structure is unaltered. Scale bar in (D) for (C)–(D): 2 μm.
(E–G) TEM micrographs of cartridges containing control, v1001, and n-syb mutant terminals, respectively. Demarcating glia are colored blue and photoreceptor terminals green to accentuate the structures. Scale bar in (E) for (E)–(G): 1 μm.
(H–J) Individual terminals that are boxed in (E)–(G). Arrows: active zones; arrowheads: capitate projections (glial invaginations); double arrowheads: mitochondria. Scale bar in (H) for (H)–(J): 500 nm.
(K–N) Quantification of organelles. Both v1001 and n-syb mutant terminals exhibit an increase in vesicle density of about 2.5-fold and a reduced number of capitate projections. Error bars are SEM.

