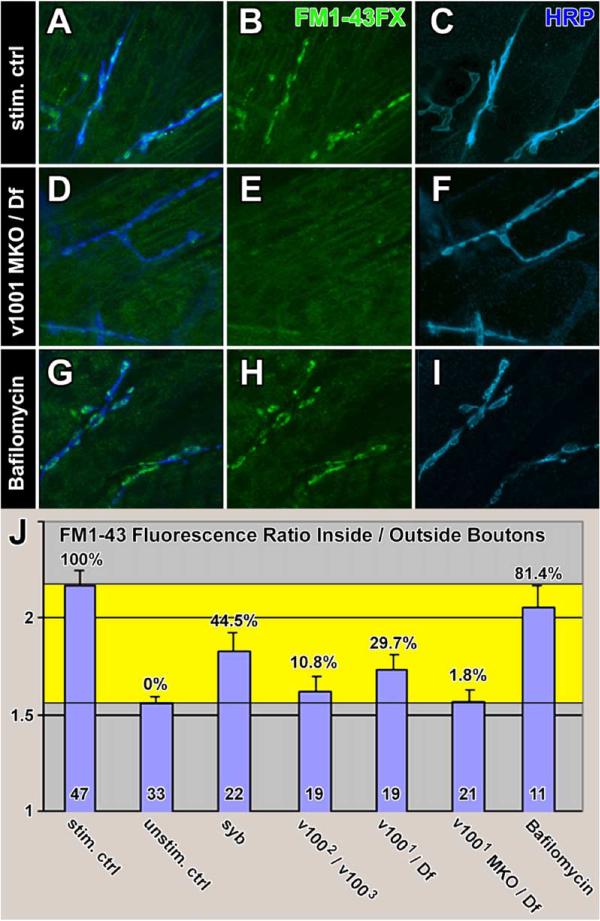
Figure 7. FM1-43 Uptake at the Embryonic NMJ.
(A–C) FM1-43FX uptake experiment using a 5 min 30 mM K+ stimulation paradigm.
(D–F) FM1-43FX uptake using the same stimulation paradigm in a v1001 MKO/Df mutant.
(G–I) FM1-43FX uptake using the same stimulation paradigm after 15 min preincubation with 1 μM Bafilomycin A1 (Baf) as well as 1 μM Baf in the FM1-43 staining solution.
(J) Quantification of FM1-43 uptake experiments in stimulated control (A–C), unstimulated control (Figures S4C–S4E), n-syb (Figures S4F–S4H), v1002/v1003 (Figures S4I–S4K), v1001/Df (Figures S4L–S4N), v1001 MKO/Df (D–F), and control with added Baf (G–I). Shown is the ratio of the mean fluorescence intensity of the FM1-43 channel within the boundaries of HRP staining versus muscle background in 3D high-resolution confocal datasets. The yellow area marks the boundaries defined by unstimulated and stimulated control. Percentages of FM1-43 uptake are given with respect to these boundaries. The number of individual embryos analyzed is indicated inside bars. Error bars are SEM.

