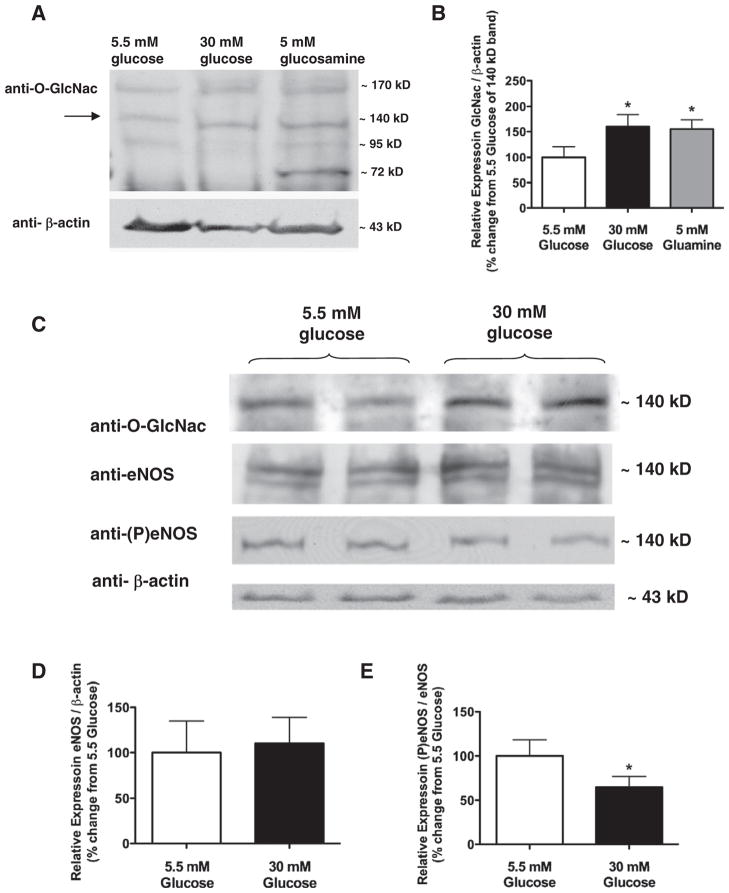
Fig. 4.
Representative Western blots (Panel A) and summary data (Panel B) show O-GlcNac formation in skeletal muscle arteries exposed to normal (5.5 mmol/L), high glucose concentration (30 mmol/L) and also to glucosamine (5 mmol/L). Western blots (Panel C) and summary data (Panel D and E) of normalized densitometry ratios from four independent experiments show O-GlcNac, eNOS and P-eNOS-Ser1177 levels. β-actin was used for normalizing of loading variations.

