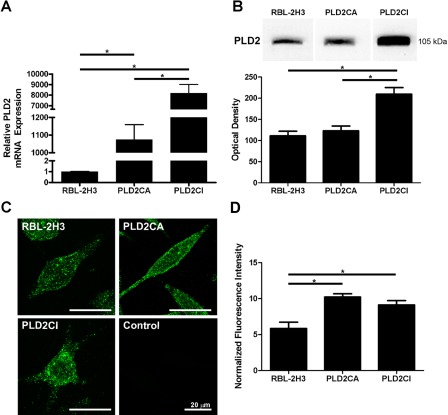
Figure 1.
Expression and distribution of PLD2. The levels of PLD2 transcripts were measured in RBL-2H3, PLD2CA, and PLD2CI cells. PLD2CA and PLD2CI cells had significantly higher levels of transcripts than did RBL-2H3 cells (*=p<0.05) (A). Lysates of RBL-2H3, PLD2CA, and PLD2CI cells were immunoblotted for PLD2 using an antibody against the internal sequence of PLD2 (B) and the resulting bands quantified. The PLDCI cells expressed significantly higher levels of PLD2 (*=p<0.05). Differences in the intracellular distribution of PLD2 were also seen (C). In RBL-2H3 and PLD2CA cell lines, PLD2 was localized throughout the cell cytoplasm, whereas in PLD2CI cells, PLD2 appeared to be localized mainly in the cell body. PLD2, green. The fluorescence intensity seen in PLD2CA and PLD2CI cells was significantly higher than that of the RBL-2H3 cells (*=p<0.05).

