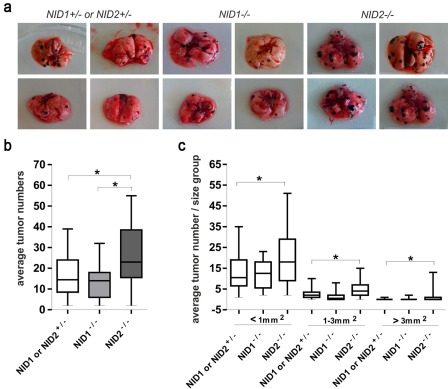
Figure 1.
Tumor metastasis in nidogen-deficient mice. (a) Representative lung metastasis in NID1–/–, NID2–/–, and control (NID1+/– and NID2+/–) mice 20 days after injection of B16-F1 melanoma cells into the tail vein. (b) Numbers of lung surface metastatic colonies in NID1–/–, NID2–/–, and control (NID1+/– and NID2+/–) mice 20 days after injection of B16-F1 melanoma cells into the tail vein. The total number of lung metastatic colonies was counted on both sides of the lung, and the mean values were calculated. Three independent experiments were performed with 29 control (NID1+/– and NID2+/–), 20 NID1–/– mice, and 24 NID2–/– mice. The p-value (*) was different between control and NID2–/– mice (p<0.05). (c) Tumors were graded into three types based on the area covered by individual tumors (tumors with areas less than 1 mm2, between 1 and 3 mm2, larger than 3 mm2). In all three categories, NID2–/– mice showed statistically significantly higher tumor numbers (*). Statistical analysis was performed using one-way ANOVA.

