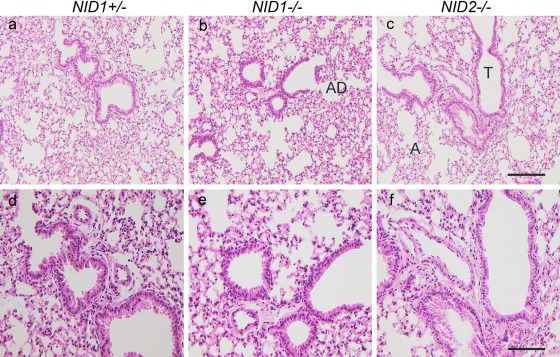
Figure 3.
Lung histology in nidogen-deficient mice. Hematoxylin and eosin staining of lung sections from NID1+/– (a, d), NID1–/– (b, e), and NID2–/– (c, f) shows a comparable tissue architecture in all three genotypes. T, terminal bronchiole; A, alveoli; AD, alveolar duct. Scale bars = 180 µm (a–c); = 90 µm (d–e).

