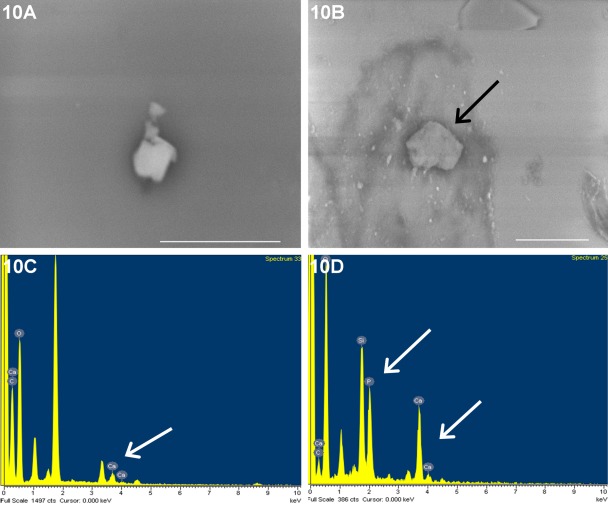
Figure 10.
In vitro nucleation of calcium phosphate polymorph by TRIP-1. (B,D) Electron micrograph of calcium phosphate deposits on rTRIP-1 coated cover glass subjected to in vitro nucleation and its corresponding EDX analysis respectively. B scale bar = 10 µm. White arrows point to calcium and phosphate peaks. 10A and 10C are the images of deposits obtained from BSA coated cover glass used as a control and its EDX analysis respectively. Bars = 5μm.

