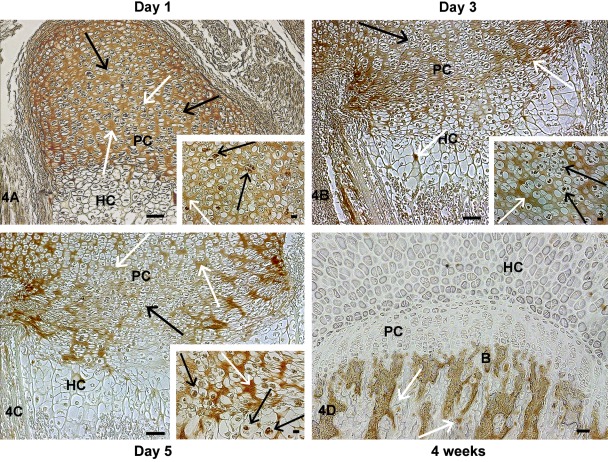
Figure 4.
Localization of TRIP-1 in the femoral growth plate region during early endochondral ossification. Localization of TRIP-1 in the growth plate region in the long bone sections of postnatal day 1 (A), day 3 (B), day 5 (C), and 4-week-old (D) mice. Black arrows represent expression in chondrocytes. White arrows represent expression in the ECM. Inset shows higher magnification images of TRIP-1 expression in nucleus of the chondrocytes. HC = hypertrophic chondrocytes; PC = proliferating chondrocytes; B = bone. A–C bars = 50 µm; D bar = 100 µm; inset bar = 10 µm.

