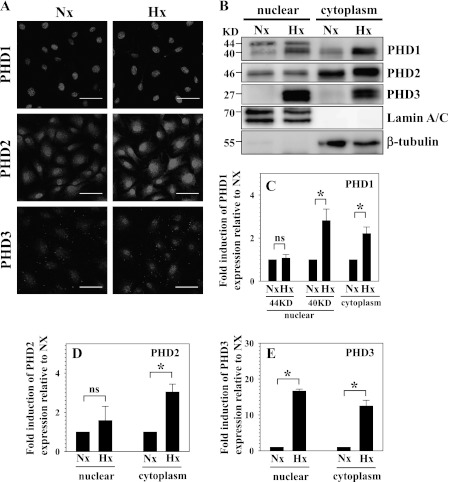
FIGURE 2.
Cellular localization of PHDs in NP cells under normoxia and hypoxia. A, immunofluorescence analysis of cellular localization of PHDs in NP cells. PHD1 is localized in the nucleus, whereas PHD2 and PHD3 are present in both the nucleus and cytoplasm. Magnification ×20. B, Western blot analysis of cellular localization of PHDs in NP cells. Two splice variants of PHD1 (44 and 40 kDa) are present in the nuclear fraction, whereas only the 40-kDa variant is detected in the cytoplasm (27). The 40-kDa band shows hypoxic induction. PHD2 is localized in the nucleus and cytoplasm, and its expression is increased by hypoxia in cytoplasmic fraction. The PHD3 level is higher in the nucleus than cytoplasm. Expression in both compartments is robustly induced by hypoxia. KD, kilodalton. C, D, and E, multiple blots were quantified by densitometric analysis. Expression of β-tubulin for cytoplasmic and Lamin A/C for nuclear protein was used as a loading control and to calculate relative expression levels. C and D, the expression of PHD1 (40 kDa) was induced in both the nuclear and cytoplasmic fraction by hypoxia. PHD2 only in the cytoplasmic fraction was significantly induced by hypoxia. E, PHD3 expression was robustly increased in both nucleus and cytoplasm under hypoxia. Data is represented as mean ± S.E. of three independent experiments performed in triplicate (n = 3). *, p < 0.05. ns, not significant.

