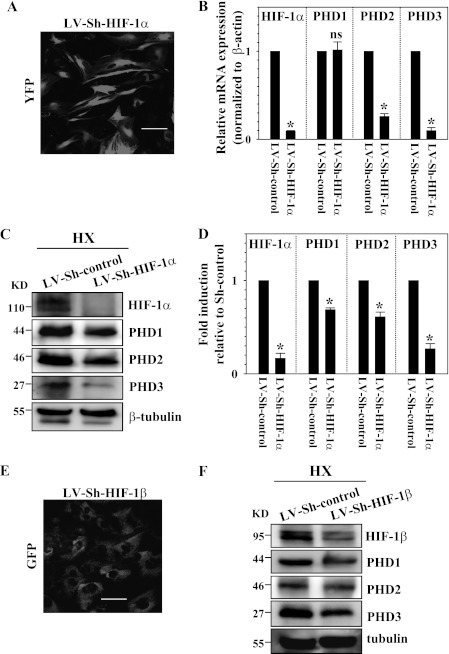
FIGURE 7.
Role of HIF-1α in controlling PHD expression. A, immunofluorescence analysis of NP cells transduced with lentivirus coexpressing Sh-HIF-1α (LV-Sh-HIF-1α) with YFP shows high transduction efficiency. Magnification ×20. B, real-time RT-PCR analysis of HIF-1α and PHD expression in nucleus pulposus cells transduced with LV-Sh-control or LV-Sh-HIF-1α under hypoxia. Note that the significant reduction of HIF-1α was seen in the cells transduced by LV-Sh-HIF-1α. HIF-1α-suppressed cells evidenced significantly decreased mRNA expression of PHD2 and PHD3 but not of PHD1. C, Western blot analysis of cells transduced with LV-Sh-control or LV-Sh-HIF-1α under hypoxia. The HIF-1α level was suppressed by LV-Sh-HIF-1α compared with cells transduced with control lentivirus (LV-Sh-control). Note that the reduction of all PHDs was seen in the cells transduced by LV-Sh-HIF-1α. KD, kilodalton. D, densitometric analysis of multiple blots from the experiment described in C above. Protein expression of all PHDs is decreased significantly, correlating with suppression of HIF-1α. E, immunofluorescence analysis of NP cells transduced with lentivirus coexpressing GFP with Sh-HIF-1β shows high transduction efficiency. Magnification ×20. F, Western blot analysis of cells transduced with LV-Sh-control or LV-Sh-HIF-1β. HIF-1β was suppressed by LV-Sh-HIF-1β compared with cells transduced with control lentivirus (LV-Sh-control). Note that the reduction of all PHDs was seen in the cells transduced by LV-Sh-HIF-1β. Data are represented as mean ± S.E. of three independent experiments performed in triplicate (n = 3). *, p < 0.05. ns, not significant.

