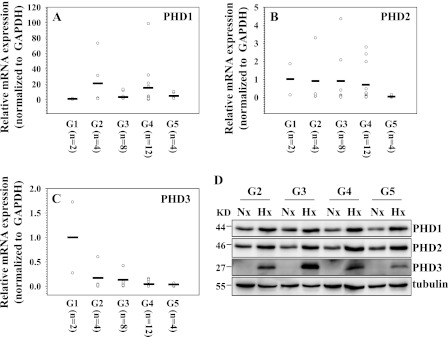
FIGURE 9.
Expression of PHDs in degenerate human NP tissues and hypoxic response of PHDs in NP cells isolated from these tissues. G1-G5 represent grades of increasing severity of disc degeneration. (A, B, and C). Real-time RT-PCR analysis of PHD1 (A), PHD2 (B), and PHD3 (C) expression. Note that PHD1 mRNA levels were higher in degenerate tissues, whereas PHD2 and PHD3 levels decreased. Expression is shown relative to the mean expression of G1 samples. The horizontal line represents the mean expression of all the samples in the same grade. KD, kilodalton. D, Western blot analysis of PHD expression in NP cells isolated from human tissues with different grades of degeneration. Note that the expression of PHDs increased under hypoxia in all the samples.

