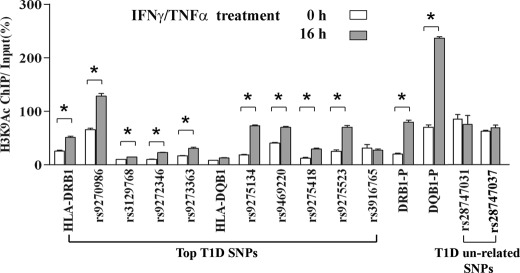
FIGURE 6.
ChIP-qPCR analysis of histone H3K9Ac-enrichment levels at key T1D SNPs loci in THP1 cells treated with and without IFNγ/TNFα. THP-1 cells were cultured in RPMI 1640 medium containing 5 mm glucose and treated with 20 μm IFNγ and 10 μm TNFα for 16 h. The ChIP was performed with histone H3K9Ac antibody, and ChIP-qPCRs with primers spanning the top T1D SNPs region shown, as well as HLA-DRB1-P and HLA-DQB1-P (same regions showing H3K9Ac changes in Figs. 3 and 4) were performed as described under “Experimental Procedures.” Two T1D unrelated SNPs, rs28747031 and rs28747037, were also included as controls and did not show any increases in H3K9Ac. Primer sequences are provided in supplemental Table S2. Data are shown as mean ± S.E. from triplicates. *, p < 0.001 treated versus untreated (0 h).

