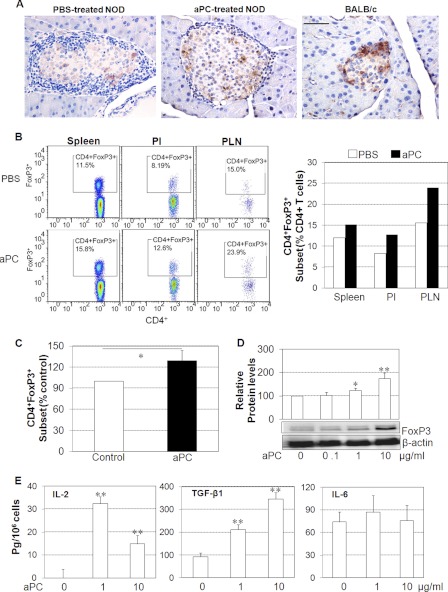
FIGURE 4.
aPC induces Tregs in vivo and in vitro. A, immunostaining for FoxP3 (brown) in pancreatic islets of NOD and BALB/c nondiabetic mice at 18 weeks of age. NOD mice were treated with aPC (2 mg/kg) or PBS for 10 weeks. BALB/c mice at the same age served a positive control. Scale bar, 100 μm. B, left, flow cytometry showing the frequency of CD4+FoxP3+ cells in total CD4+ T cells in spleens, pancreatic islets (PI), and pancreatic lymph nodes (PLN) isolated from either PBS or aPC-treated 18-week-old NOD mice, detected by a Treg cell kit. Right, flow cytometry data are shown as % CD4+ FoxP3+ cells of total CD4+ T cells, from six mice for each group (PBS group: mean blood glucose 12.6 mm, one mouse was diabetic; APC group: mean blood glucose 7.9 mm, all nondiabetic). C, percentage of CD4+FoxP3+cells in spleen cells from 10-week-old nondiabetic NOD mice treated with aPC (10 μg/ml) for 3 days in vitro, compared with control, detected by flow cytometry using a Treg detection kit. Data are shown as mean ± S.E. (n = 3. D, FoxP3 in spleen cells treated with aPC for 3 days and detected by Western blotting, semi-quantified by image analysis, and expressed as relative protein levels (percent of control, mean ± S.E., n = 3). E, IL-2, IL-6, and TGF-β1 in media of spleen cells treated with aPC in vitro for 3 days and measured by ELISA. Data are expressed as mean ± S.E. (n = 3). *, p < 0.05; **, p < 0.01.

