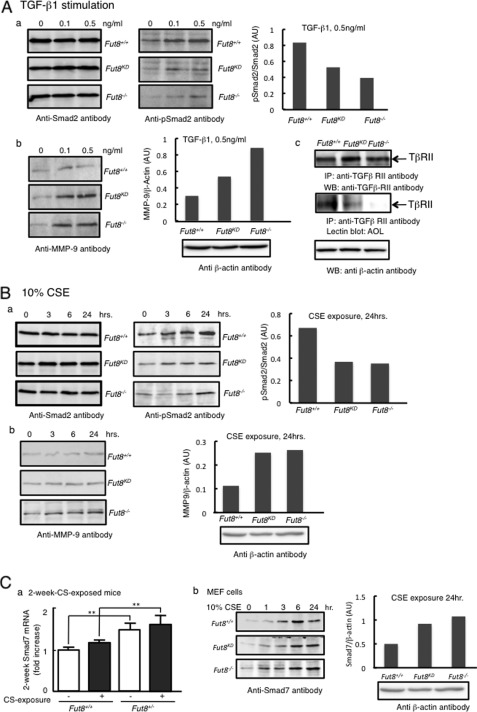
FIGURE 5.
Smad pathway is impaired by exposure to CS in Fut8 mutant mice. A, the alteration of Smad signaling pathway by TGF-β1 stimulation was examined. Serum-starved MEF cells were treated with or without TGF-β1 at the indicated concentrations as described under “Experimental Procedures.” Panel a, the cell lysates were detected by immunoblotting with anti-Smad2 antibody (left) and anti-phospho-Smad2 antibody (middle), and the ratio of phospho-Smad2 (pSmad2) to Smad2 for samples stimulated with 0.5 ng/ml TGF-β1 is shown (right). Panel b, the production of MMP-9 was checked using anti-MMP-9 antibody (left), and the quantity of MMP-9 (arbitrary units (AU)) is shown for samples stimulated with 0.5 ng/ml TGF-β1 (right). Panel c, the fucosylation levels on TGF-β receptor II were analyzed. TGF-β receptor II (TβRII) was immunoprecipitated (IP) from whole cell lysates and then subjected to 10% SDS-PAGE. After electroblotting, blots were probed with anti-TGF-β receptor II antibody (upper) and A. oryzae lectin (AOL) (middle). The protein concentration of all of the lysates used for immunoprecipitation was normalized as shown by immunoblotting of β-actin (lower). WB, Western blot. B, the time course of the CSE effect on the Smad pathway was then examined. Cells were treated with 10% CSE for the indicated periods of time leading up to simultaneous harvest and analyzed by immunoblotting. Panel a, the blots were developed with anti-Smad2 antibody (left) and anti-phospho-Smad2 antibody (middle), and the ratio of phospho-Smad2 to Smad2 for samples stimulated with 10% CSE for 24 h is shown (right). Panel b, the production on MMP-9 related to the CS exposure was checked by immunoblotting using anti-MMP-9 antibody (left). As for samples stimulated with 10% CSE for 24 h, the quantity of MMP-9 (arbitrary units) is shown (right). C, the effect of CSE on the expression of the Smad7 protein. Panel a, real-time PCR analysis of Smad7 was performed for 2-week CSE-exposed mouse samples. Total RNAs from 2-week CSE-exposed Fut8+/+ and Fut8+/− mouse lungs were used as templates. Values were normalized to RPL4 levels and are expressed as -fold increase against the value for wild-type (Fut8+/+) non-CS-exposed mice. **, p < 0.02 versus the matched groups connected with bars. Panel b, Fut8-deficient MEF cells treated with 10% CSE for the indicated periods of time were harvested and analyzed with anti-Smad7 antibody (left). The band density of the samples stimulated by 10% CSE for 24 h is shown (right). For all of the experiments, β-actin from the cell lysate was included for normalization.

