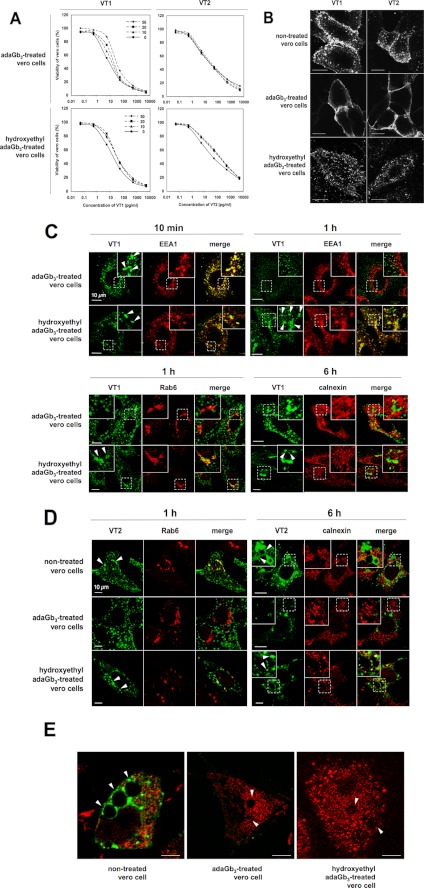
FIGURE 5.
A, toxicity of VT1/VT2 to adaGb3- or OHEtadaGb3-treated Vero cells. Vero cells were incubated with 0, 10, 20, or 50 μm adaGb3 or OHEtadaGb3 at 4 °C for 1 h. Cells were treated with 10-fold serially diluted VT1 or VT2 and incubated at 37 °C. Cell viability was monitored after 72 h and expressed as a percentage of control cells, which were treated with neither VT nor adaGb3 analogues. B, staining of non-treated, adaGb3-treated, or OHEtadaGb3-treated Vero cells with fluorescent VT1 or VT2. Vero cells were treated with or without adaGb3 or OHEtadaGb3. Then Alexa488-VT1B or Texas Red-VT2 was bound on ice for 1 h. Cells were washed, fixed, and viewed with a confocal microscope. Bar, 10 μm. C, trafficking of VT1 in adaGb3 or OHEtadaGb3-treated Vero cells. VT1 was internalized at 37 °C for 10 min, 1 h, or 6 h in adaGb3- or hydroxyethyl adaGb3-treated Vero cells. VT1, EEA1, Rab6, and calnexin were localized as described in the legend to Fig. 4. D, trafficking of VT2 to the Golgi and ER in non-treated, adaGb3-treated, or hydroxyethyl adaGb3-treated Vero cells. Bound VT2 was internalized at 37 °C for 1 or 6 h. Cells were fixed, permeabilized, and labeled with anti-Rab6 (Golgi) or anti-calnexin (ER). Fluorescently stained cells were viewed with a confocal microscope. (Texas Red-VT2 is pseudocolored green, and organelle markers detected with anti-rabbit-Alexa488 colored red, for ease of comparison). E, VT2-induced vacuolation in non-treated, adaGb3-treated, or OHEtadaGb3-treated Vero cells. VT2 was bound and internalized at 37 °C for 6 h. VT2 (green) and calnexin (red) were detected as described for D. Fluorescently stained cells were viewed with a confocal microscope. Arrowhead, vacuoles; bar, 10 μm. Toxin colocalization with organelle markers was quantitated (supplemental Table 2).

