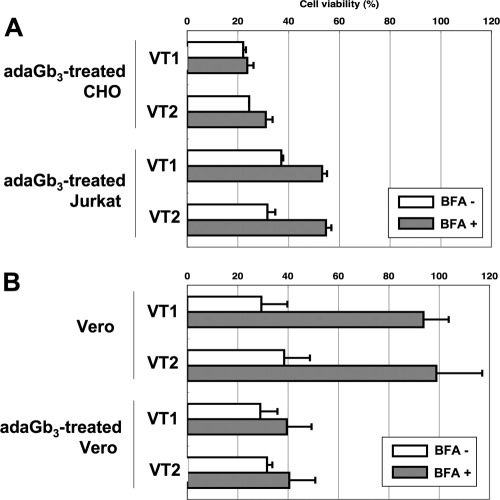
FIGURE 6.
Effect of BFA on VT1- and VT2-induced cell killing. Cells were incubated ± 0.5 μg/ml BFA for 30 min prior to the VT addition. VT1 was added at 10 μg/ml for adaGb3-treated CHO/Jurkat cells (A), 0.1 ng/ml for non-treated Vero cells (B, top), and 100 ng/ml for adaGb3-treated Vero cells (B, bottom). VT2 was added at 10 μg/ml for adaGb3-treated CHO/Jurkat cells, 1 ng/ml for non-treated Vero cells, and 100 ng/ml for adaGb3-treated Vero cells. Cell viability was monitored after 21.5 h and expressed as a percentage of control cells in the absence of VT.

