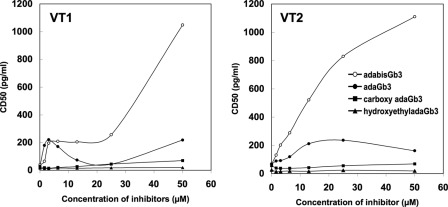
FIGURE 7.
Inhibition of verotoxin cytotoxicity. Increasing concentrations of adaGb3, carboxyadaGb3, OHEtadaGb3, or adabisGb3 were premixed with VT1 or VT2 dilutions at 37 °C for 1 h and then added to Vero cells for 1 h. Cells were then washed and incubated at 37 °C for 72 h. Live cells were stained with crystal violet, and viability was plotted as a percentage of untreated Vero cells. From this, the CD50 values of VT1 (left)/VT2 (right) preincubated with adaGb3 analogues were determined and plotted as a function of analog concentration.

