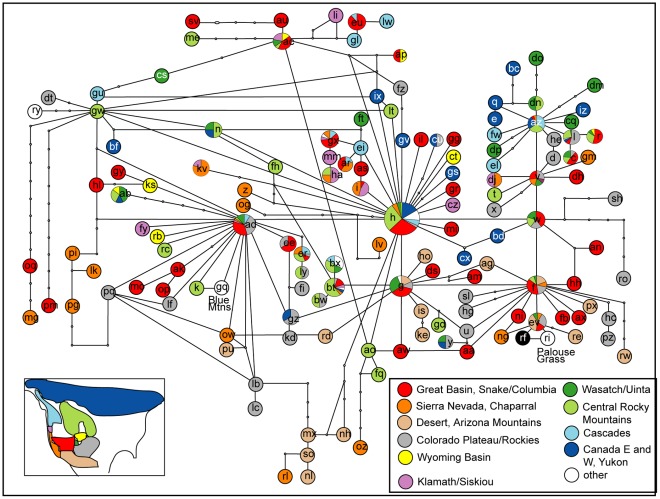
Figure 3. Taxon identity plotted on statistical parsimony network based on 149 ITS types.
Sharing of ITS types by taxa was calculated for every ITS type in the network. Pie Charts indicate percentage of taxa sharing the ITS type in question. It is obvious that some taxa are restricted to portions of the network while others share several of the ancestral ITS types (e.g. Boechera retrofracta).

