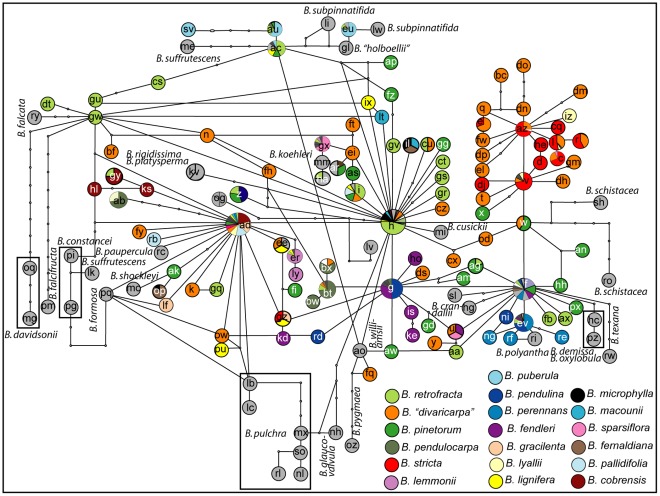
Figure 4. Geographical distribution of accessions plotted on statistical parsimony network based on 149 ITS types.
Accessions were sorted into geographical groups (see colour legend of Figure) and distribution of accessions sharing an ITS type over geographical regions was calculated and is displayed as pie charts. There is a trend for ITS type lineages to occur more in particular geographical regions than in others indicating (at least past) gene flow throughout that region.

