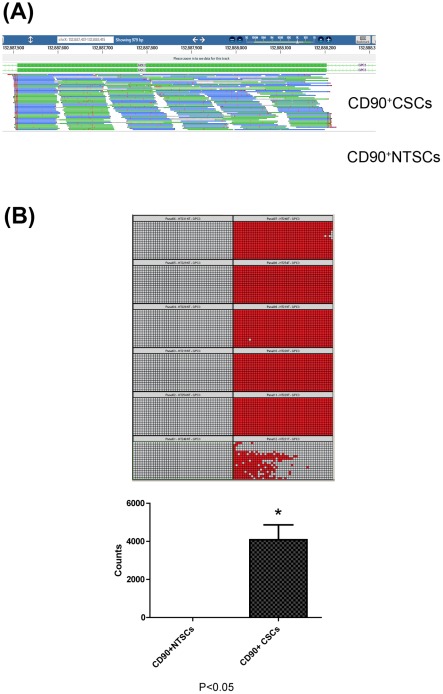
Figure 4. Read distribution along the GPC3 gene and quantitative measurement of mRNA GPC3 by Fluidigm digital array assay.
(A) Alignment of RNA-Seq sequence reads to GPC3 gene. Significantly higher read counts were detected for CD90+CSCs when compared with those of CD90+NTSCs, indicating the specificity of GPC3 in liver CD90+CSCs. For illustration purpose, only one exon of the gene was shown. (B) Each digital array chip can run twelve samples. The six samples of the right hand side of the chip were CD90+CSCs, and of the left hand side were the corresponding CD90+NTSCs. Digital array partitioned a RNA sample premixed with RT-PCR reagents into individual 765 RT-PCR reactions. In each partition, the red color indicated positive expression of GPC3 at mRNA level, whereas grey indicated no expression. The GPC3 mRNA level was quantified by counting the positive signals by the software. The mRNA expression of GPC3 was predominantly expressed in CD90+CSCs as compared with CD90+NTSCs (P<0.05).

