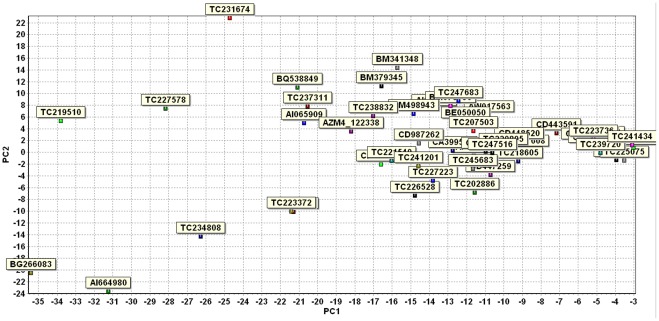
Figure 4. Plot of PCA analysis on the 50 candidate genes differentially expressed in Mp313E versus Va35.
Genes highly expressed in Mp313E were presented in the area with positive values of y axis coordinates, whereas genes located in the area with negative values of y axis coordinates were those expressed more inVa35.

