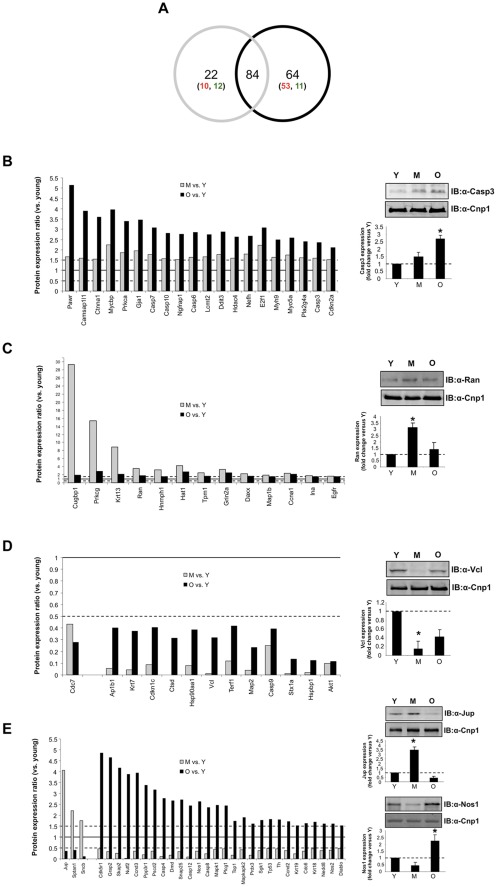
Figure 2. Age-dependent protein expression changes in the rat hypothalamus.
(A) Venn diagram analysis of significantly-regulated (p<0.05) proteins in the middle versus young (grey circle) and the old versus young (black circle) antibody array analyses. Proteins uniquely regulated in either middle age (22) or old age (64) animals are subsequently broken down into up-regulated (red numbers) or down-regulated (green numbers) groups. The 84 commonly-regulated proteins were further dissected into different regulatory-behavior groups represented in panels B–E. For each regulation-behavior group an exemplary protein is verified from the animal hypothalamic pools (Y–young, M–middle aged, O–old). (B) Proteins up-regulated in both M (grey bars) and O (black bars) hypothalami compared to Y animals, with O ratio >M ratio. The associated validation was performed using western blot for caspase 3 (Casp3). (C) Proteins up-regulated in both M (grey bars) and O (black bars) hypothalami compared to Y animals, with M ratio >O ratio. The associated validation was performed using western blot for Ran. (D) Proteins down-regulated in both M (grey bars) and O (black bars) hypothalami compared to Y animals, with M ratio >O ratio and O ratio >M ratio. The associated validation was performed using western blot for vinculin (Vcl). (E) Proteins differentially regulated between M or O timepoints relative to Y (up-regulated at M and down-regulated at O (verified using junction plakoglobin-Jup), or down-regulated at M and up-regulated at O (verified using nitric oxide synthase 1-Nos)). For each verification, data on each histogram is represented as mean ± SEM from the multiple animal pools. Statistical significance is as follows: * = p<0.05, ** = p<0.01, *** = p<0.001.

