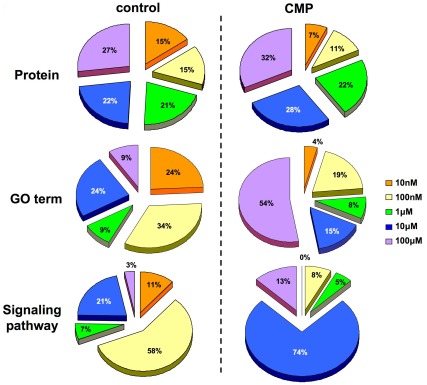
Figure 6. Dose-dependent distribution of MeCh-stimulated signaling activity in diverse cellular contexts.
Proportional diagrams representing the relative distribution of phosphoproteins (Proteins)/GO term groups (GO term)/signaling pathways (Signaling Pathway) unique to an individual stimulating MeCh dose (color coded) in either cellular context (control or CMP).

