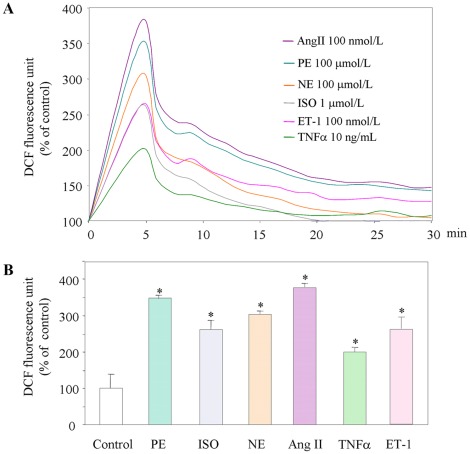
Figure 3. Intracellular generation of ROS in cardiomyocytes exposed to various compounds.
(A) Relative DCF fluorescence of ROS generation. (B) Percentage increase in ROS generation vs control cells after 5 min. *p<0.01 vs control cells; n = 5. PE, phenylephrine; ISO, isoprotenerol; NE, norepinephrine; AngII, angiotensin II; ET-1, endothelin-1, TNFα, tumor necrosis factor α.

