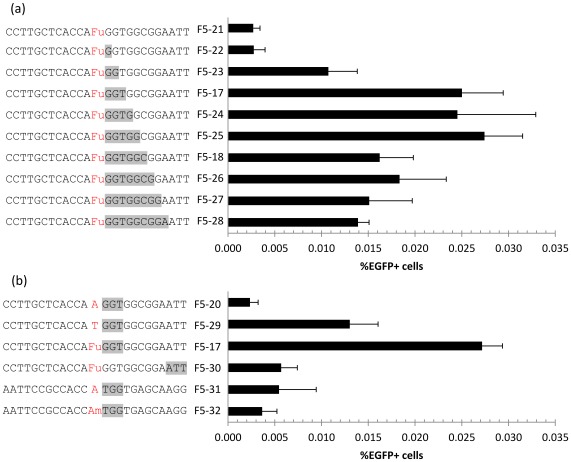
Figure 6. Effects of PTO in long-term survival of corrected cells.
(a) Varying numbers of PTO bonds 3′ to the mismatch, shown in gray, suggest 3-5PTO bonds as optimal for balancing toxicity and stable targeting frequencies, assayed 14-days after oligo transfection by flow cytometry. (b) Testing the position of PTO bonds, strand targeted and use of modified bases in long term survival. F5-20 used as non correcting control, F5-17, -29 and -30 are complementary to the non-transcribed strand, while F5-31, -32 are complementary to the transcribed. n = 4.

