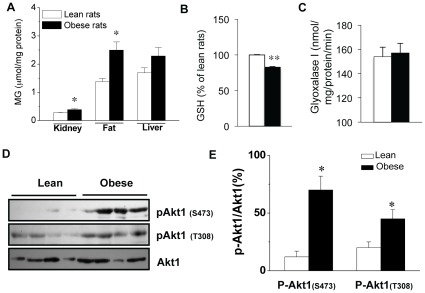
Figure 1. Increased MG accumulation, reduced GSH level and glyoxalase I activity were related to Akt1 expression in obese Zucker rats.
(A) MG levels in kidney, fat, liver of 16-week old Zucker lean or obese rats. *P<0.05, n = 4−8 in each groups. (B) GSH level decreased in the adipose tissue of Zucker obese rats while glyoxalase I activity (C ) remain unchanged compare with Zucker lean rats. GSH level was presented as % of that in control group. *P<0.05, n = 4 in each groups. (D) The expression of p-Akt1 and Akt1 in adipose tissue of lean and obese Zucker rats. *P<0.05, **P<0.01, n = 4 in both groups. The results of Western blotting were quantified by Chemigenus® Bio imaging system company) and presented as the percentage of that from control cells (E). □ Zucker lean rats, ▪ Zucker obese rats.

