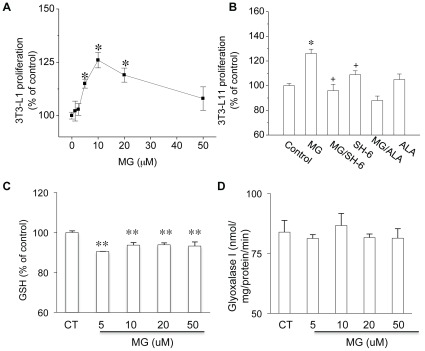
Figure 2. The effect of MG on 3T3-L1 cell proliferation, GSH level and glyoxalase I activity.
The relative cell proliferation of each group was presented as the ratio between arbitrary absorbance on 570 nm of each group and that from the control group without treatment. The effect of different MG concentrations on cell proliferation was shown in (A) and the effect of 10 µM MG with/without SH-6 and alagebrium was shown in (B). The reduced GSH level (C ) and unchanged glyoxalase I activity (D) was observed in 3T3-L1 cells treated with 5, 10, 20 and 50 µM MG. *P<0.05, **P<0.01 vs control cells; + P<0.05 vs MG treated cells; n = 12 in each group.

