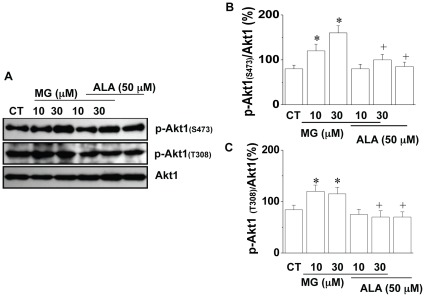
Figure 4. Effect of MG on Akt1 phosphorylation in 3T3-L1 cells.
After 24 h treatment with or without MG (10 µM) in the presence or absence of SH-6 (10 µM)/alagebrium (50 µM), the protein levels of Akt1, (A), Representive Western blot of phospho-Akt1 (p-Akt1(Ser473), p-Akt1(thr308)) and Akt1; (B), The level of phospho-Akt1(Ser473) in 3T3-L1 cells with/without MG treatment; (C ), The level of phospho-Akt1(thr308) in 3T3-L1 cells with/without MG treatment. *P<0.05 vs control (CT) cells; + P<0.05 vs MG treated cells. The results were based on data from three experiments. CT: control; ALA: alagebrium.

