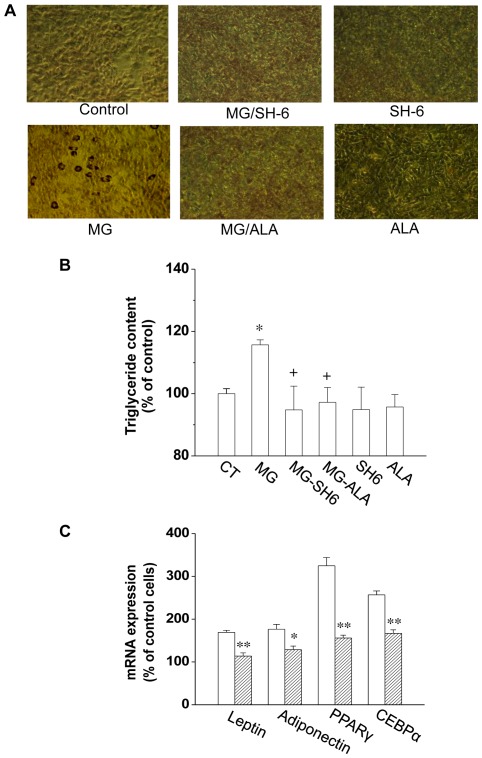
Figure 6. MG induced adipogenesis in 3T3-L1 adipocytes.
After treated with MG, SH-6 or alagebrium for 48 h, cells were cultured till confluence and differentiation. The Oil Red O staining in adipocytes was shown in (A). The lipid content in adipocytes from different groups was quantified and presented as the percentage of that from control cells (B). The mRNA expression of adiponectin, PPARγ, C/EBPα and leptin in differentiated cells treated with MG alone or with MG and alagebrium were determined by real-time PCR (C). *P<0.05; **P<0.01; n = 3 in each groups. The open square in Figure 6C represents cells treated with MG; the stripped square represents cells treated with MG alagebrium. CT: control; ALA: alagebrium.

