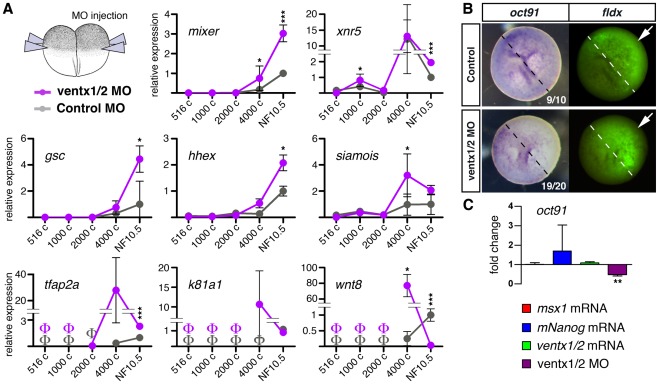
Figure 4. ventx1/2 activity is necessary to maintain an uncommitted cell population in early gastrulae.
(A) NF2-embryos were injected radially twice in both blastomeres with control MO (30 ng/blastomere), or a 1∶1 mix of ventx1/2 MOs (30 ng/blastomere). Variations of gene expression at 516-, 1000-, 2000-, 4000-cell and NF10.5 stages were assessed by RT-QPCR as in Fig. 2. Dorsal (siamois, gsc, hhex), and ventral (wnt8) mesendoderm, endoderm (xnr5, mixer) and ectoderm (tfap2a, k81a1) markers were monitored. Kinetic graphs represent means of fold-change relative to NF10.5 controls +/− s.e.m, and significance was assessed using paired t-test (*p≤0.05, **p≤0.005, ***p≤0.0005), and undetectable levels of transcript noted as Φ. (B) Animal injections were performed twice in a single blastomere NF2-embryos, using MO conditions described in (A); fldx was used as a lineage tracer. WISH with an oct91 probe (left panel) were performed at stage NF10.5 and the progeny of the injected blastomere was revealed by fluorescence (right panel). Embryos are positioned with the animal side upwards; white arrows indicate the injected side. (C) Injections were performed using mRNA and MO conditions described in Fig. 2. All embryos were collected at stage NF10.5 and processed for RT-QPCRs using the pluripotency marker oct91. Data and graphs are presented as in Fig. 2.

