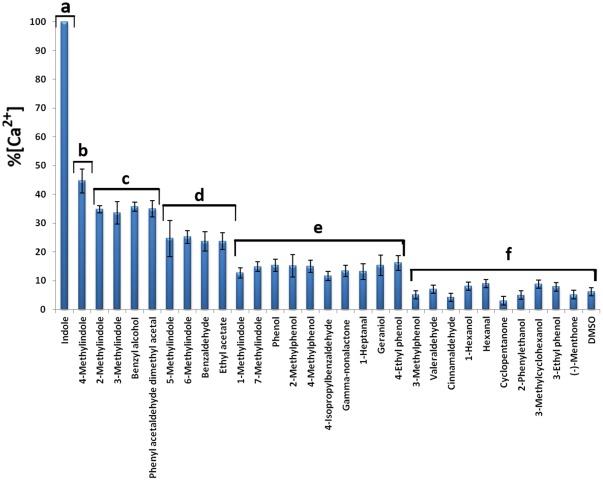
Figure 3. Quantification of the intracellular Calcium ([Ca2+]i) in HEK293 cells expressing AalOR2 along with DmOR83b, in response to the compounds reported in Tab.1.
A free intracellular Ca2+ concentration was determined using the 340/380 excitation ratio for Fura-2. Each response was normalized to the maximum responder. AalOR2 is strongly tuned to indole, and responds with a lower sensitivity to other methylindoles, and benzaldhyde. Furthermore, benzyl alcohol and phenyl acetaldehyde yielded responses that were at least 35% of the response to indole. The results shown are the means of five separate experiments (n = 5). Error bars = S.E.M. A 1-way ANOVA test (df among groups = 30, df within group = 124, F-ratio = 214,44, p≤0,05) was performed followed by a Bonferroni correction for multiple test comparisons considering as significant the modified Bonferroni p≤1,67×10⁻³. Letters on top of the bars indicate that means differ significantly from one another.

