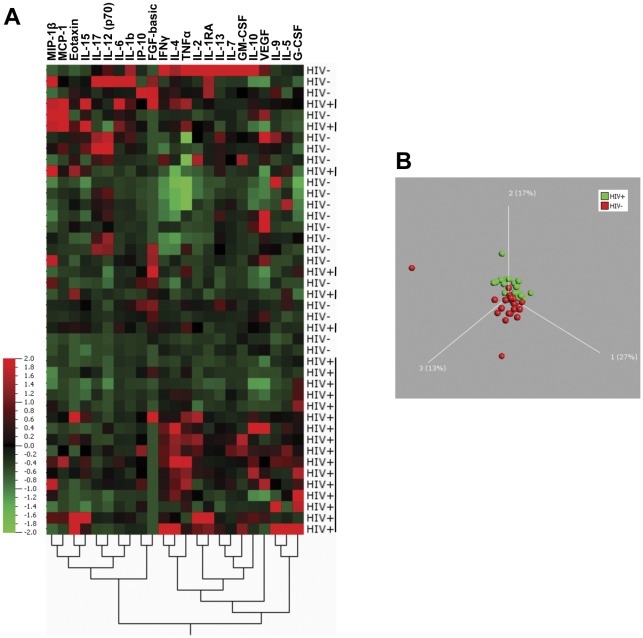
Figure 2. Expression profiles of baseline plasma cytokines in TB+HIV.
− and TB+HIV+ individuals. (A) Two-dimensional unsupervised hierarchical clustering of baseline cytokine profiles in TB+HIV− (n = 20) and TB+HIV+ (n = 22) subjects. The normalized values for each cytokine are depicted according to the color scale, where red and green represent expression above and below the median, respectively. (B) Three-dimensional representation of principal component analysis (PCA) of HIV− (red) and HIV+ (green) individuals. Each dot represents one subject based on values of all 23 cytokines studied. The percentage of variances is depicted on the 3 axes. The distance in space between each dot represents the relatedness between each individual.

