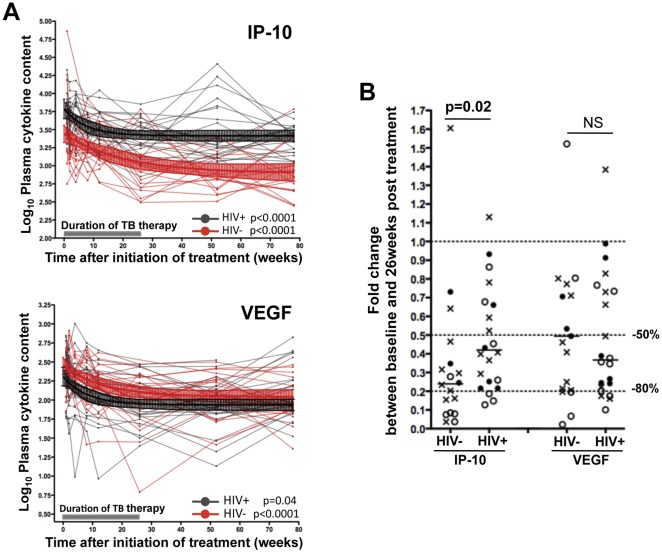
Figure 4. Comparison of the decrease rate of IP-10 and VEGF in TB+HIV.
− and TB+HIV+ individuals upon TB therapy. (A) Longitudinal plasma IP-10 and VEGF concentrations before, during and after TB therapy in TB+HIV− (Red) and TB+HIV+ (Black) individuals. Values were log-transformed. Median values with 95% CI for TB+HIV− (n = 20) and TB+ HIV+ (n = 22) individuals are depicted in red and black, respectively. A shaded grey box represents the duration of TB therapy. Statistical analyses were performed using random-effects linear regression. (B) Comparison of fold-changes in plasma IP-10 and VEGF concentrations between baseline and 26-week measurements (end of TB therapy) in TB+HIV− and TB+HIV+ subjects. Each dot represents one individual. Open circles correspond to individuals who presented with sputum conversion at ≤8 weeks, closed circles correspond to individuals who presented with sputum culture conversion between 12 and 26 weeks after TB therapy initiation and crosses identify individuals where sputum culture conversion occurred after 26 weeks post treatment. Doted lines depict 50% and 80% reduction of cytokine expression levels. Statistical analyses were performed using non-parametric Mann-Whitney U test.

