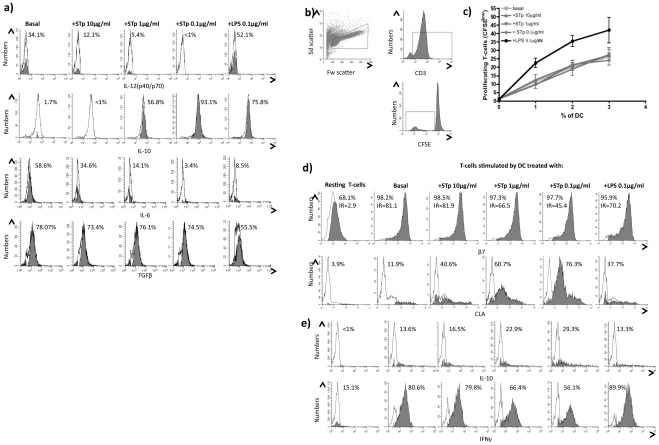
Figure 2. STp induced i) regulatory cytokines in blood enriched DC and ii) stimulated T-cells, which acquired a skin homing profile.
a) Intracellular ongoing cytokine production of IL-12(p40/p70), IL-10, IL-6 and TGFβ in blood DC of healthy controls after 24 hours stimulation with STp (10 µg/ml, 1 µg/ml and 0.1 µg/ml) or LPS (100 ng/ml) compared to a basal culture. Closed histograms represent the percentage of positive cells assessed by intracellular cytokine staining and SED normalized subtraction from antibody stained cells cultured in the absence of monensin. That approach accurately quantifies the ongoing cytokine production of DC in a time window of 4 hours (monensin incubation) irrespectively of the initial cytokine amounts within the cells. b) Stimulatory capacity of DC was assayed in a mixed leukocyte reaction (MLR). T-cells were identified in the forward (Fw) and side (Sd scatter) and subsequent CD3 identification of dividing T-cells as CD3+ and CFSElow. c) Dose response proliferation of T-cells upon 5 days stimulation with different doses of allogeneic DC (0%, 1%, 2% and 3%) previously pulsed with different doses of STp or LPS compared to untreated DC (basal). Results show the mean±SEM of three independent experiments. d) Imprinted homing profile of stimulated T-cells (CFSElow) was determined regarding their surface expression and intensity ratio (IR) for the gut-homing integrin β7 and the skin-homing CLA molecules compared to resting T-cells cultured in the absence of DC. e) Acquired cytokine profile of such cells was determined as intracellular cytokine content of both IL-10 and IFNγ. Closed histograms represent the percentage of positive cells after subtraction from respective isotypes. All displayed histograms are representative of three independent experiments performed with similar results.

