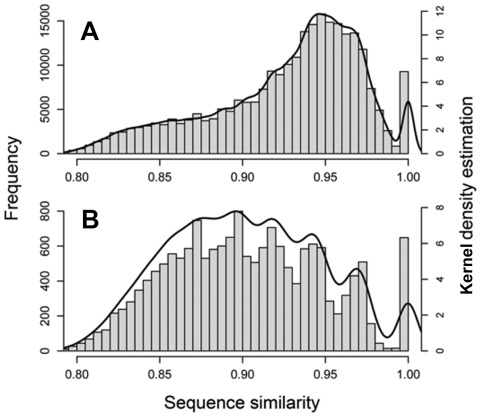
Figure 5. Sequence similarity of NicCL3.
Histogram of sequence similarity of NicCL3 derived reads in N. tomentosiformis (a) and N. tabacum (b). Kernel density estimations are also shown (black line). Note that both species have evidence of sequence amplification and/or homogenisation (peak at sequence similarity of one). There are 6 peaks in N. tabacum, perhaps indicative of several independent rounds of ancient amplification and or homogenisation. There are a relatively high proportion of low similarity sequences in N. tabacum compared to N. tomentosiformis.

