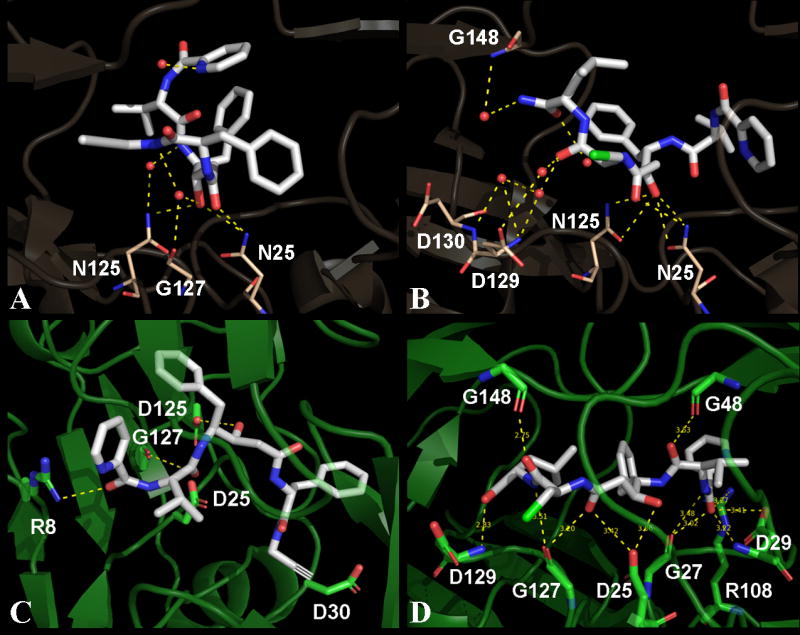
Figure 2.

Three-dimensional view of contacts for compounds 1 and 2. Panels A and B show contacts made by compounds 1 and 2 respectively with the MDR protease in their corresponding crystal structures. Panels C and D show docked models of wild type HIV-1 protease with compounds 1 and 2 respectively. The compounds are represented as white sticks in all panels while the protease residues that are involved in polar contacts are highlighted as sticks. The protease residues are colored in baize and green for the MDR and wild type protease respectively. All the polar contacts are represented as yellow dashed lines and the active site water molecules are represented as small red spheres. Three waters that have direct contacts with compound 1 are shown in panel A. Out of the three water molecules in panel A, two bridge the compound to N125 and G127 of the MDR protease. Five waters are shown in panel B out of which, four waters are directly in contact with compound 2. Three waters bridge the compound to D129 and G148 in panel B. The binding orientation of compound 2 is more stretched-out, with more contacts compared to that of the compound 1.
