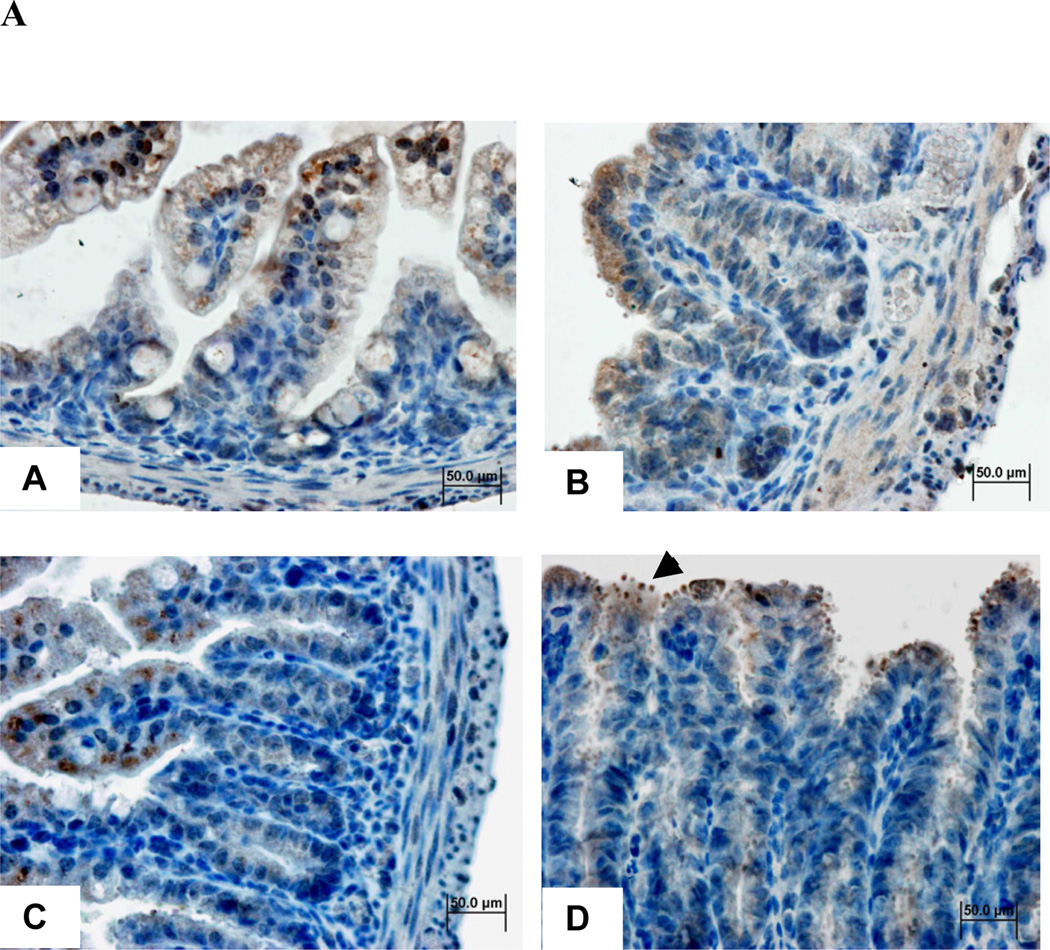
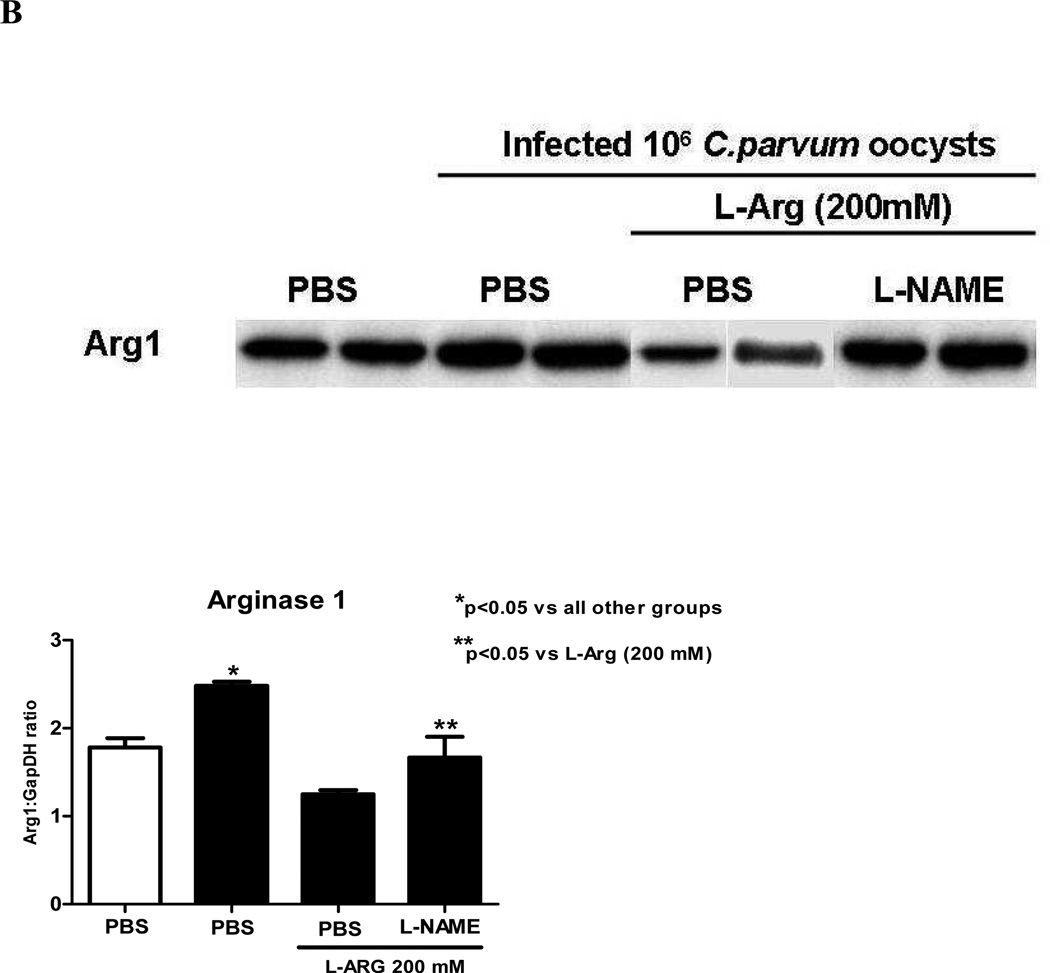
FIGURE 3.
(A) Ileal arginase I immunohistochemistry from experimental groups, 400X (a) Undernourished uninfected control, (b) undernourished infected control; (c) undernourished infected mice treated with L-arginine 200 mM; (d) undernourished infected mice treated with L-arginine 200 mM and the NOS inhibitor NG-nitroarginine methyl ester (L-NAME), at the dose of 20 mM; arrowhead indicates C.parvum oocysts. Brown color represents arginase 1 immunostaining. Counterstaining with Harris’ hematoxylin.
(B) Ileal immunoblots of the experimental groups for arginase I (ARG1). Band densitometry was plotted after normalizing for the housekeeping protein GADPH. Statistical analyses were done using Student T test. The results are shown mean ± SEM. *p< 0.05, significant increase versus uninfected control and **p<0.05, significant decrease versus infected control. N=4 for each group.


